
Categories World News
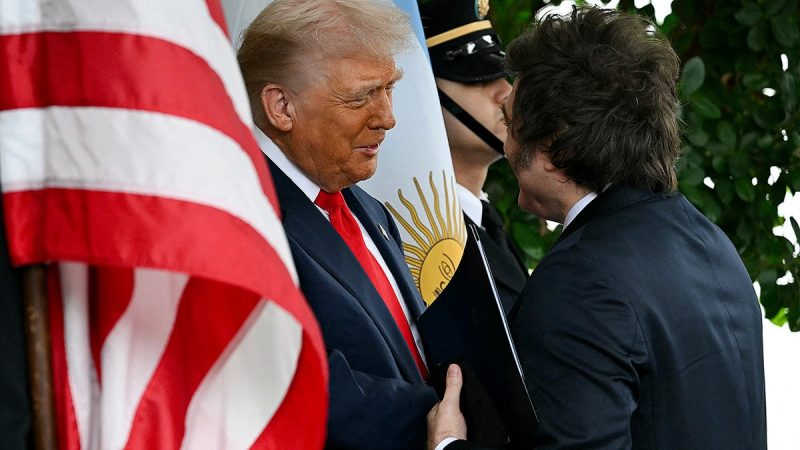
Man convicted of Iran-backed Trump assassination plot compared his plan to Butler shooting: FBI
March 7, 2026
A Pakistani man convicted Friday of plotting to assassinate President Donald Trump and other politicians told an FBI agent he thought Iran